
How to set up, configure and get tracking with Google Analytics. Featuring a thrilling (🤷) deep dive into metrics and interpretation.
Dav Nash
18 min read
Before we begin, be aware this article is a Longboi™. Do skip ahead to the bits which are relevant to you, if you must:
If you made the correct decision to read from the top, well done, I applaud you 👏!
There are any number of ways to get into digital marketing, but many of them stem from “fluffy” pursuits such as web design and copywriting.
Personally, I discovered marketing during my undergrad in English Literature, so I’m very qualified to say that (and very little else 🥲).
Now, I’m not just dunking on those of us with arts qualifications/experience. I bring this up, as it’s important to acknowledge that most marketers aren’t statisticians or mathematicians.
And yet, here we are in a career path where maths and statistics are a daily reality.
In fact, mastery of marketing analytics is what separates the “meh” marketers from the “woah” marketers.

Without our beloved marketing analytics, we’d just be guessing.
Demonstrating any kind of progress or results would be impossible, and we’d all be swiftly fired.
So, if you’re new to this stuff, come with me on a enlightening journey into analytics and how to become a “woah” marketer.

Before we get into the nitty gritty of numbers, I want to make sure you’re actually collecting those numbers correctly.
If your initial configuration is wrong, the data will be meaningless. As such, any analysis you do will be FLAWED PSEUDOSCIENCE ☠️.
There are a handful of platforms you’ll come across in your digital journey, but these are the popular ones:
Website:
Ads
SEO Tools
Yes, there are many more. No, I’m not going to add them unless you leave a very compelling comment at the bottom of this article as to why.
Let’s get your website analytics chugging along first, as without it, the rest is kinda pointless.
Head over to the Google Analytics website first, and set up an account.
Go through the account setup pages.
Some tips while doing that:
At this point, it will drag out a snippet of code for you to install on your website.🤚 STOP ⛔
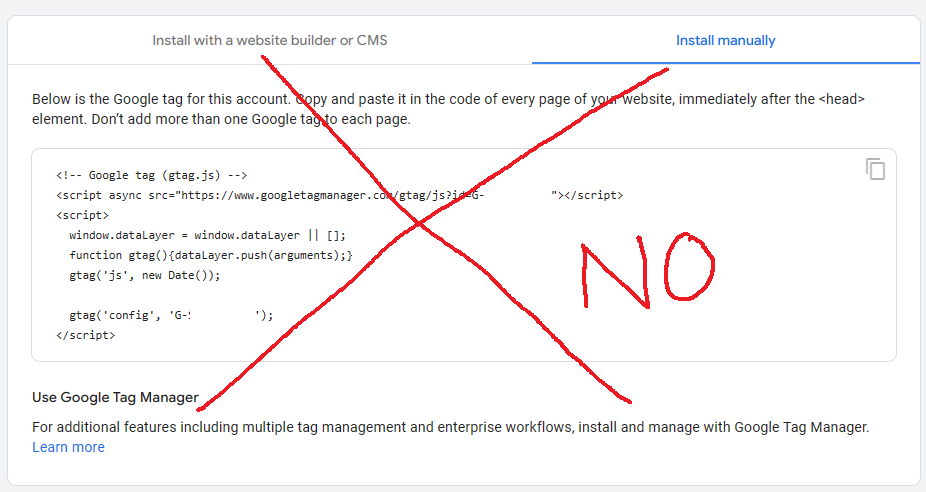
Open up a new tab and go and sign up for Google Tag Manager (GTM) (free). This will make your life easier in the future.
In GTM, if you aren’t already on the “Add a New Account” page, hit “Create Account”.

Go through the account setup pages.
Some tips while doing that:
Now GTM will drag out some code for you to install on your website.
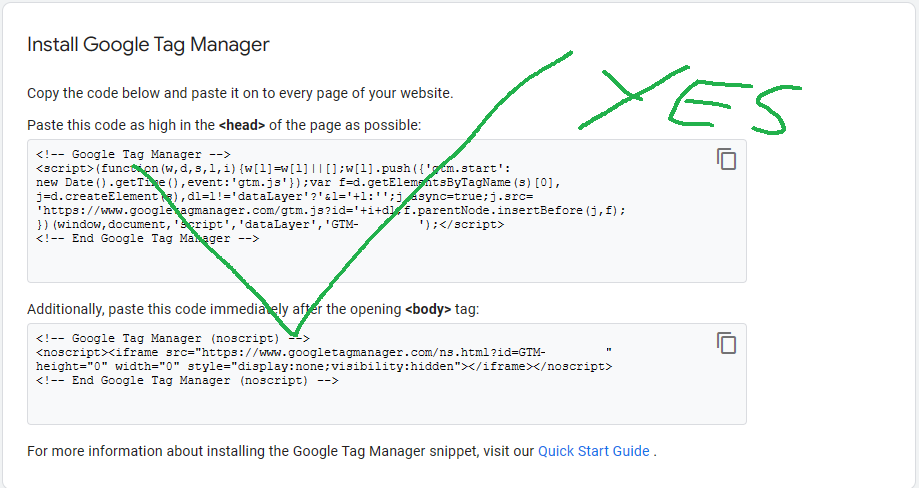
Actually go and install that code on your website. Get a developer to help if you’re clueless with this. Otherwise, search Google for:
“Install tag manager code on [ insert whatever your website CMS is (wordpress, shopify, squarespace etc) ]”
Ok, now that’s done, you don’t have to touch your site code again. That’s the whole point of GTM.
Quickly check that the code has been installed correctly by hitting the “Preview” button in the GTM dashboard.
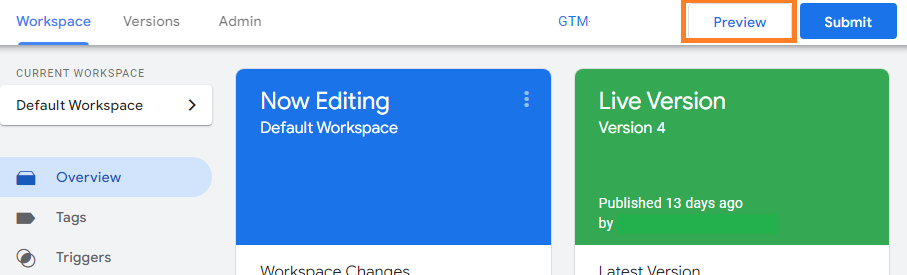
Whack in your website address and hit “Connect”:

If you can see this box in the bottom right side of your website, you’ve succeeded:
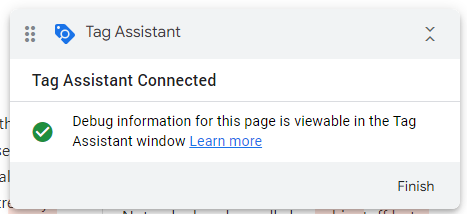
Enjoy that hit of adrenaline.

Ok, now calm back down.
You can click “Finish” and close the “Preview” tab now. Head back into the main GTM dashboard. This thing:
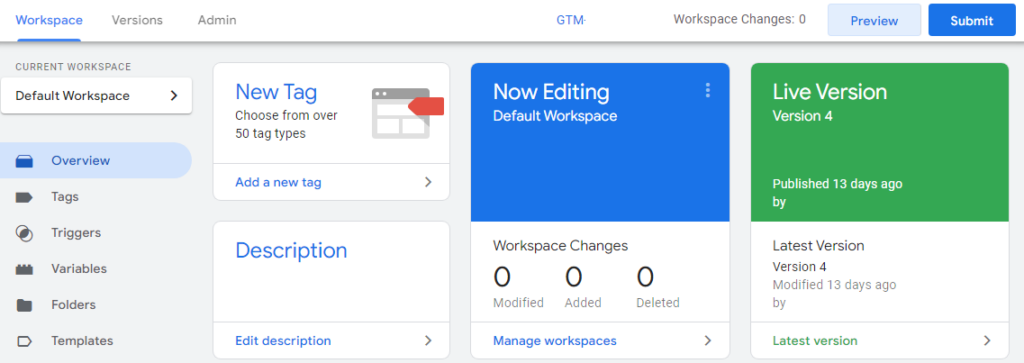
Click on “Add a new tag”.

Click on the Tag Configuration box:
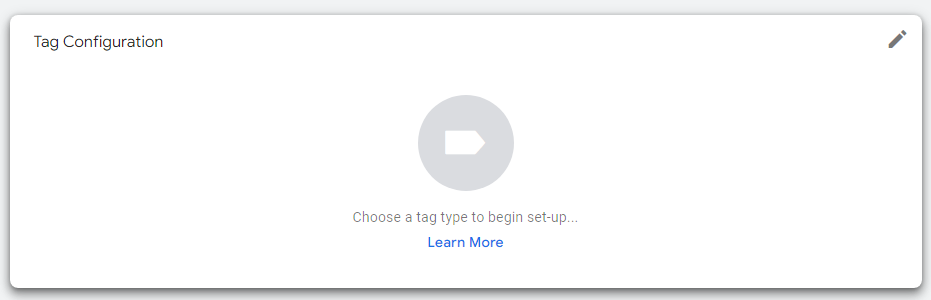
And then click “Google Analytics: GA4 Configuration”:

Now hop back over to your Google Analytics tab.
Close the pop-out with the FORBIDDEN code snippet it in it and you should be able to see a Measurement ID. Copy it.

Paste that code into the empty box in GTM.

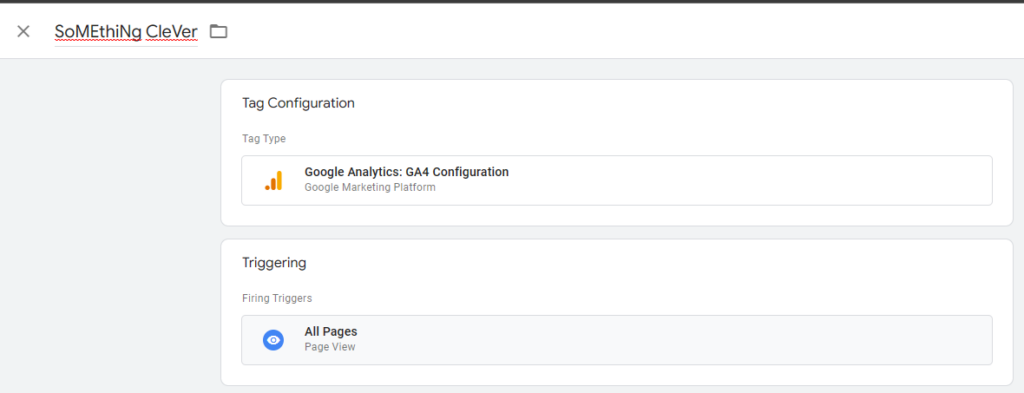
Now hit the Triggering box:

Choose “All Pages”:

Name the tag something clever, like “GA4 – Configuration”:
And hit that enticing blue “Save” button.

No, not the one above this sentence. Hit the one in GTM. Honestly, I give up.
Now you’re back on the main GTM dashboard, just hit the blue “Submit” button in the top right corner.
If you want to be organised, you can name the changes you just made to GTM and add a description.
Or, you can just hit the blue “Publish” button in the top right corner and skip the paper trail, you maverick.
Job done. You’re now sending data from your website to Google Analytics. 👍

Close the GTM tab/s. You don’t need them for now.
Head back over to GA.
There are now exactly 15 bajillion ways you can customise how GA collects and handles your data, depending on your website and preferences. If you want to get real fancy 🧐, you’re going to have to do it on your own time, sorry.
However, I will give you some pointers for basic configuration best practice.
If you just followed the above instructions, this is what you’re going to be staring at like this 👁️_👁️:
Oh God, the silence is deafening 😱. Don’t panic, it can take a day or two before you start seeing data.
In the meantime, let’s make some tweaks.
Click on the little cog in the bottom left corner.
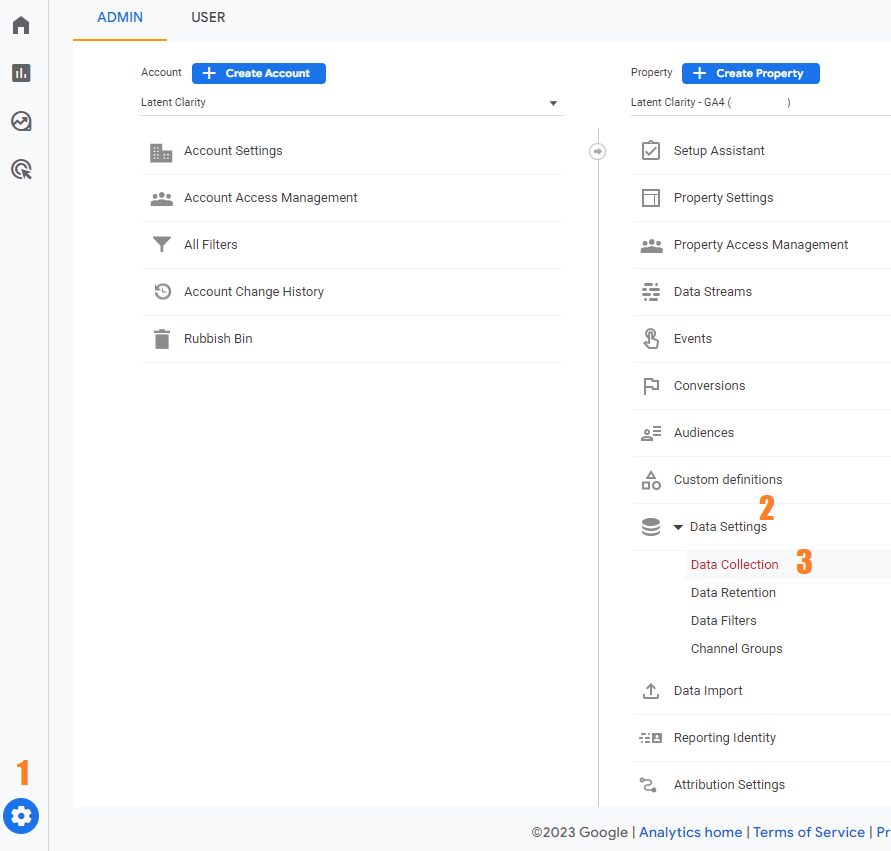
Click on “Data Collection”.
Click “Get Started”:
Hit “Continue” on the next screen, then “Activate”.
Nice, now you’re picking up a lot more data from your users.
Now you need to read (haha, sure), and accept the “User Data Collection Acknowledgement”:

Now click on Data Retention and change it to 14 months. Hit “Save”.
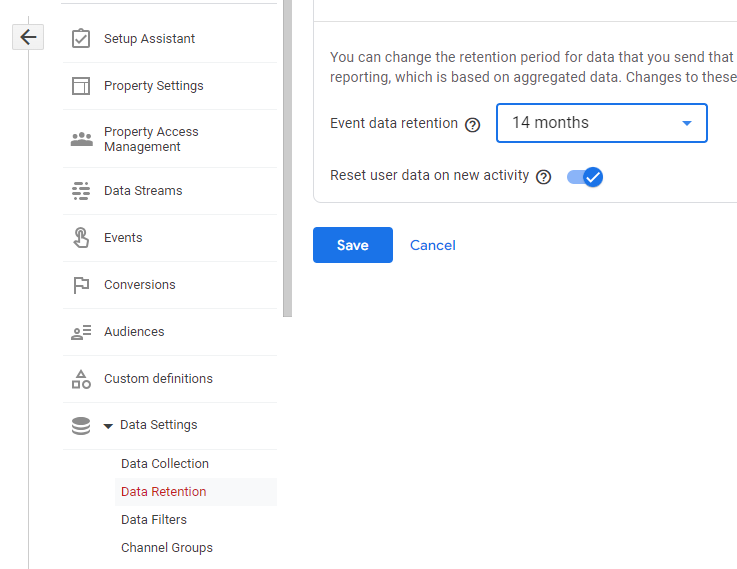
Lovely, that will keep your data around for a lot longer.
[Optional] Exclude internal IPs
This is up to you, but if you want completely clean data, you may want to stop GA from gathering data from IPs that you and your team/client use.
The upside to this is that you don’t muddy up your data with internal traffic. The downside is that it makes testing a bit more challenging.

Skip this section if you want. Otherwise, here’s how to do it:
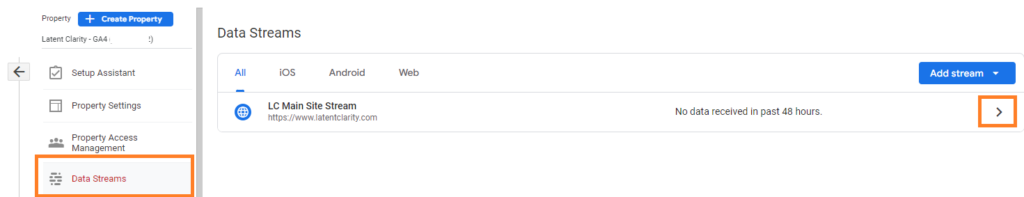
Go to Data Streams and click on the stream you set up earlier:
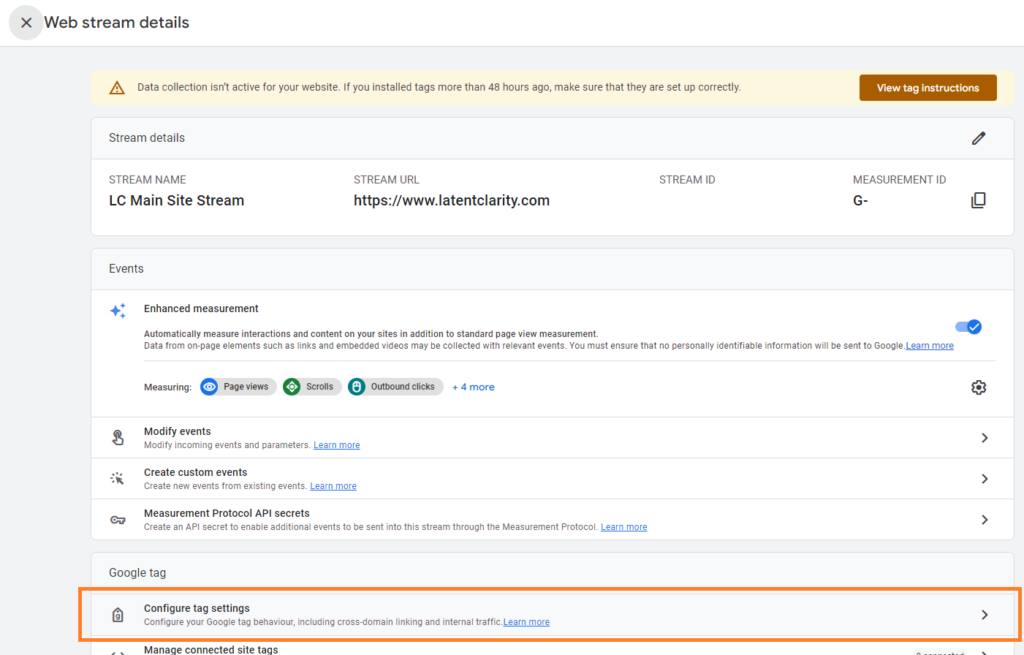
At the bottom of the screen that slides out, click on “Configure tag settings”:
In the next screen, click on “Show all” then “”Define internal traffic”:
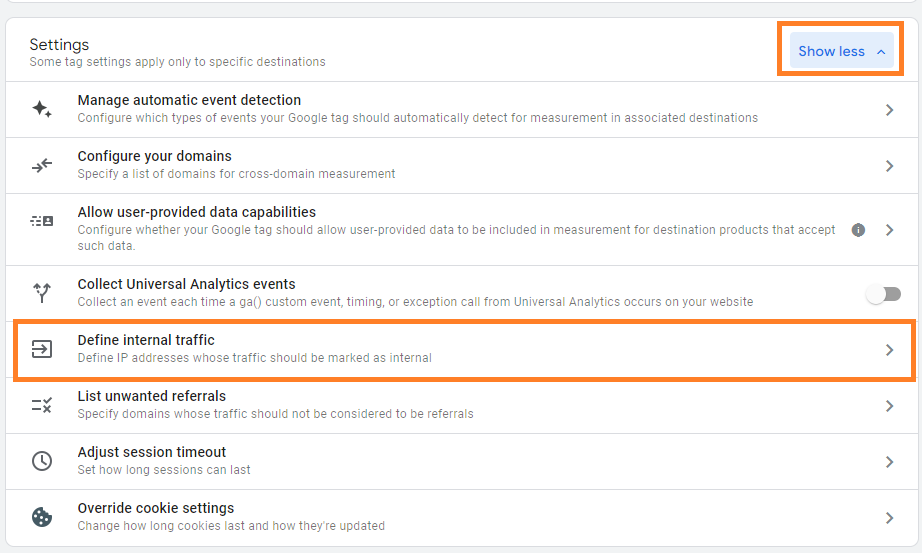
A new window will open. Click “Create“.
Then fill out the configuration:

Rule name can be anything you want. If you have people spread out over multiple IPs, I would probably just called it “Internal IPs”.
Leave “traffic_type value” as it is.
Change the match type to whatever is appropriate for your usage. I tend to go for “IP address equals“:
Paste the IP into the “Value” box. You can find your IP online, if you’re not sure.
Cick “Add condition” if you have more than one to add.
When you’re done, hit the “Create” button in the top right corner. Simples.
So data is now pouring into your GA, and it’s nice and clean and shiny. Great work 👍.
However, if we actually want to demonstrate that we’ve achieved something worth achieving, you’re going to need to track conversions.
By conversions I mean stuff like form submissions and purchases. To a lesser extent, maybe downloads and phone/email link clicks.
To be honest, anything a user does on your website that is important to you.
As you’ve just set up GTM, this is going to be a breeze.

No, just kidding. Conversion tracking is a minefield.
I will help you out with the basic methods, but there are precisely 72 gazillion ways to set up conversion tracking. If none of my methods work for you, book some 1 on 1 time with me and I can probably help you out.
This is a fairly monstrous topic in of itself, so I’ve written another article purely on conversion tracking. Head over there now, do what you need to do, and then come back when you’ve finished.
See you in a bit! 🙋♂️

Welcome back! I missed you 😭.
Before we get into the spiciness of the metrics themselves 🌶️, I want to give you a crash course in actually using GA4.
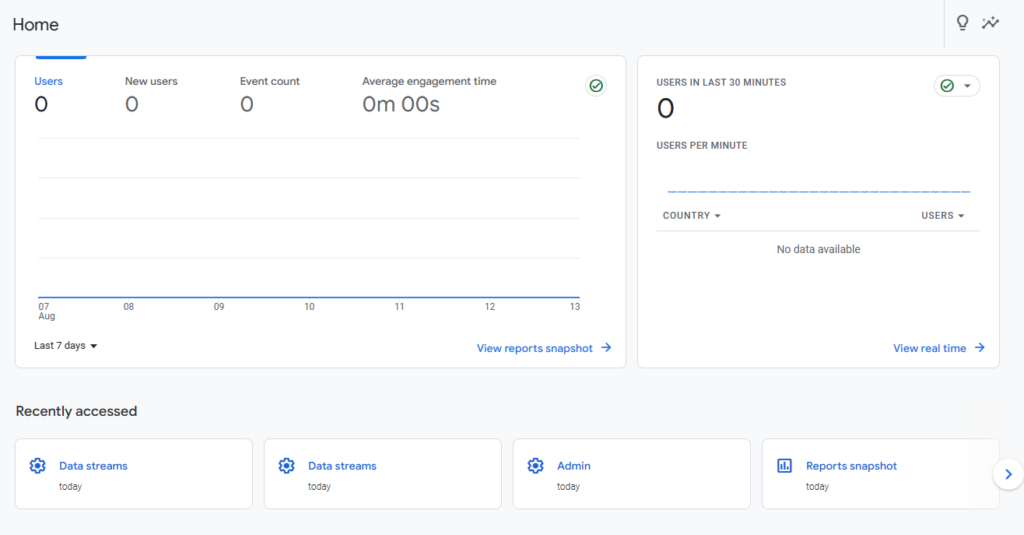
This is the main dashboard:
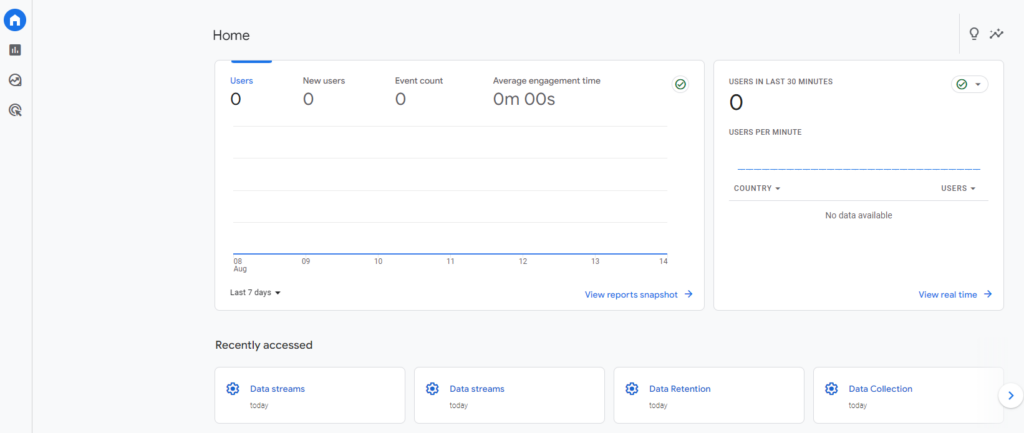
You can get back there at any time by clicking the home 🏠 symbol in the top left.
When you’ve actually got some data, this will populate the top left card with some key metrics and a line graph. You’ll also get the last 30 minutes of real time data in the graph on the top right.
Below those graphs will be a bunch of “Suggested for you” cards, which will show a (quite frankly) random selection of tables and graphs.
I recommend you don’t spend much time on this page. It’s mainly good for a quick glance to make sure your traffic hasn’t inexplicably tanked, and little else.
Next up is the Reports section:
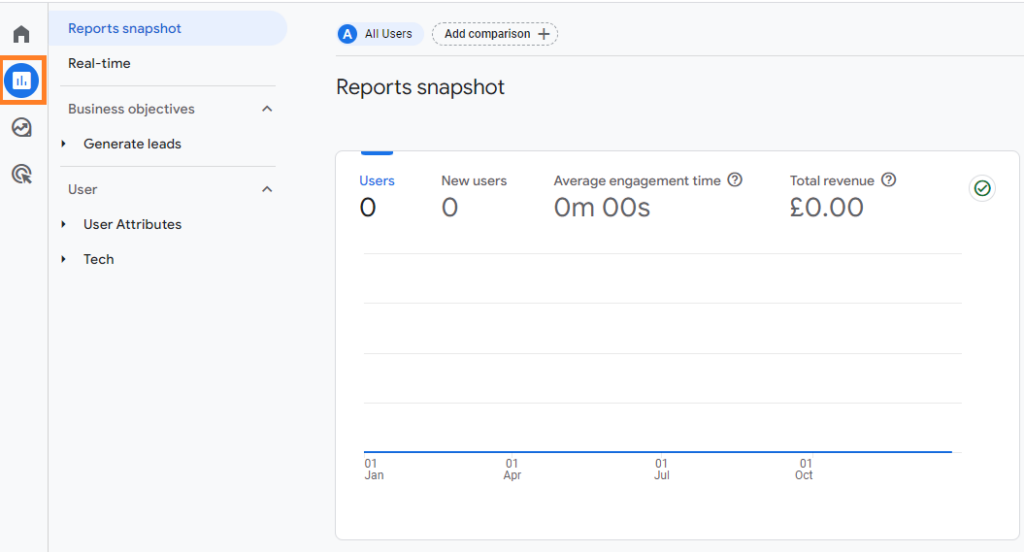
Does this screen look familiar? You’re right, it’s pretty much exactly the same as the Home dashboard. Good going, Google.

This is what it looks like with some data in it:

You’ll also notice that you get more options down the left hand side:
This is really the bread and butter of GA and where you’ll find all that juicy data.
I know you’re as excited as I am right now. This is thrilling stuff.
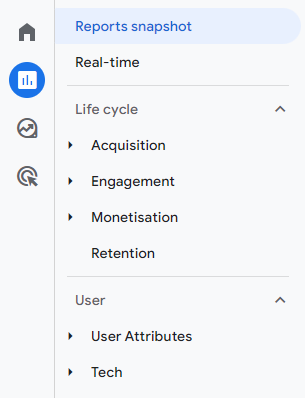
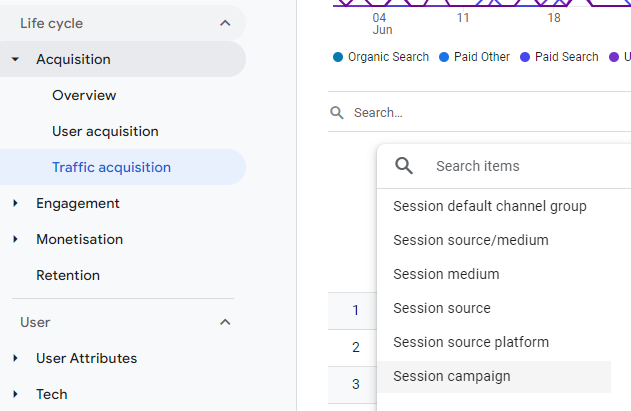
If you open up those drop down menus, you’ll find yet more things to click on:

Acquisition is where you you’ll find data on where you users/traffic came from.
Engagement is where you find data on your conversion events and the pages on your website.
Monetisation is where you can dig into data related to purchases made on your site.
Further down, you’ll find data for your demographics and devices, or in English, who (age, gender etc) is on your site and did they visit using a computer, tablet or phone:

All that should keep you busy for a while, but if you’re hankering for more, you can go back to the sidebar:
Explore will allow you to make some pretty reports and run analysis on your data.

Advertising lets you dig deeper into the campaigns you’re running.
You’re probably wondering why I’m just giving you a brief overview on this, but I’m a believer that the best way to learn somethig is to go and poke around it. Push some buttons, click stuff and see what you can do.

The nice thing about GA is that’s it’s pretty much “read only” so you can’t break anything. Feel free to satisfy your curiosity.
However, I will give you some tips for navigating your data…
Let’s jump into the “User Acquisition” report:

If you had some data, this is what you would see. Don’t sweat the metrics, we’ll go into them in the next section.
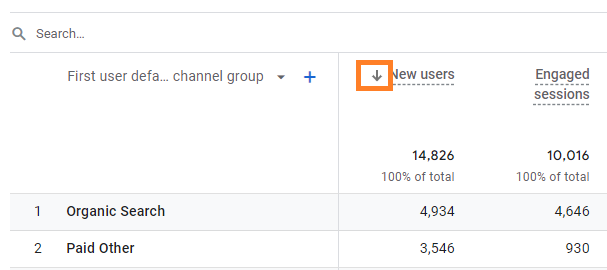
You can manipulate all report pages to some extent.
By clicking on the arrow next to a column heading, you can sort it from high to low and vice versa:
You can also click on the header of the first column to change the “Dimension”:
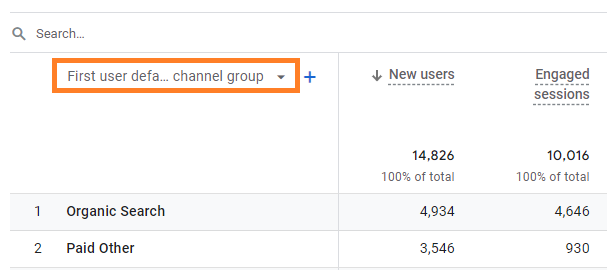
That’ll make more sense after the next section.
And you can also click the little blue “+” button to add a secondary dimension:
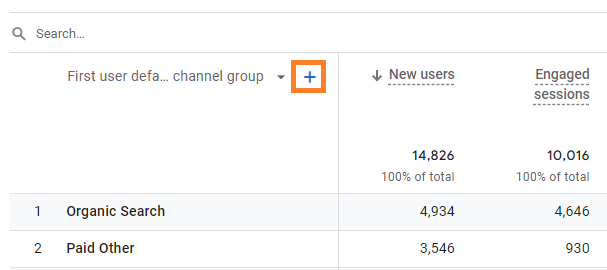
This will let you add another layer to your data, such as demographics, or location etc.
Up top, you can add filters.
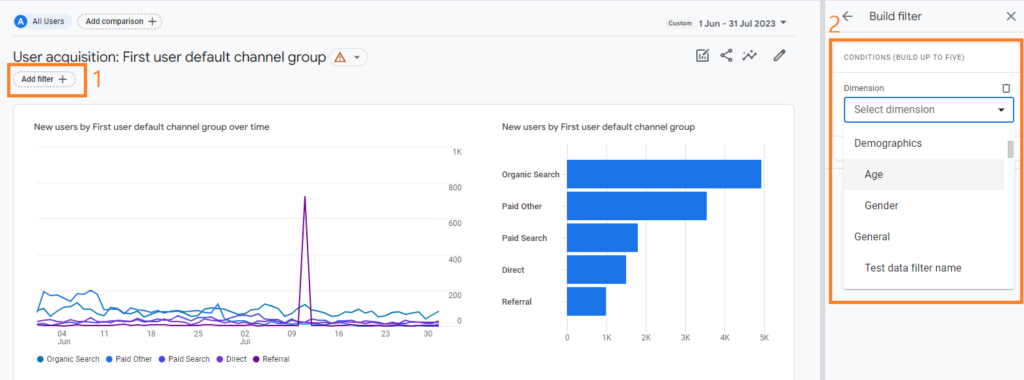
You could, for example, choose to only show data from a certain channel, like organic search, or social media.
Even further up, you can add comparisons:

This is the same process as adding a filter, but it will add another layer to your data for comparison purposes. For example, you could compare organic search vs paid search. Helpful for figuring out which channels are better.
Finally, if you click the date range in the top right corner, you’ll see this:

This is a pretty powerful way of allowing you to change the date range for your data. The best bit is the “compare” button, which lets you select two date ranges to compare. Nice for demonstrating improvements (or declines 😭) month over month/year over year.
The “Compare” toggle will add percentage differences to your data.
And that will probably do you for now. It’s not a complicated platform.
Obviously, there’s a lot more you can do with GA, but this article isn’t a deep dive into the functions. Your homework is to go and poke around in your own time. You’ll be amazed what you can find.

Alright, let’s talk about the numbers you’re actually looking at here.
Analytics come from a bunch of different tools, platforms and sources. I can’t possibly delve into all of them in detail, as it would take me millenia and you would be bored to death.
For now, we’ll focus on your website analytics. You know, the stuff we just spent time setting up.
Before we start, a quick note:
Analytics are finicky things and very few metrics are “exact” figures. You will very rarely be able to precisely match up figures between platforms, as the way they measure data varies.
Even within GA, the data is only as good as the source, and a handful of your users will slip through the cracks. They may have tracking/javascript blocked on their browers or any other number of reasons.
As such, GA should be considered as “indicative” data for analysing trends, rather than “precise” data for counting exact figures.
Ok, with that out of the way…
Here are the Key Metrics:
in GA4, these are actually “Active Users”. It’s a important distinction, as in GA3 (Universal Analytics, RIP 🪦), “Users” counted all users, regardless of engagement.
“Active Users” have engaged with your site in some way (scrolling, clicking, rage spamming buttons etc). If you want to see a number for all of your users, look for the “Total Users” metric.
Without bogging down in the tech and variations here, “Users” is loosely an indication of the number of disctinct people who have visited your website within the chosen date range.
Why is this helpful? It gives you an idea of how many people have actually visited your site and interacted with it.
One user can have multiple sessions. Not to be confused with a sesh.
A session starts when a user opens up your website and views a page (assuming they aren’t already in a session).
A session lasts until there has been 30 minutes of inactivity, or the user closes the tab/browser and leaves your site.
Why is this helpful? Comparing the number of users to sessions lets you roughly work out how many times your users have returned to your website. A cheat code metric for this is “Engaged sessions per user”, where GA works it out for you. Thanks, Google. 👍
These guys can be a combined metric, or you can look at them individually.
Source is literally the source of that traffic, e.g., facebook, google, youtube.
Medium is the type of channel, e.g., social media, email, organic search.
Why is this helpful? It allows you to see where your users are coming from. This is invaluable, as you can then start figuring out which sources/mediums are the most lucrative when comparing these metrics with stuff like revenue or conversions.
A cousin of source/medium, but will only show up when it’s been explicitly mentioned by the source link.
What do I mean by this? If you put a link to your website somewhere else on the web, like a social advert, you can specify a campaign name to be passed to GA. You can use UTM tracking links to send GA the source, medium and campaign for that user. Why? Because GA doesn’t get that data automatically from most sources. Links without this data will just show up as a “referral” in the medium column.
If that’s the first time you’ve heard about those UTM links, have a read of my guide on UTM tracking.
Why is this helpful? For the same reason as source/medium. It allows you to attribute users and conversions to specific campaigns that you’re running. This is a fundamental requirement for working out Return on Ad Spend (ROAS), AKA, “how much revenue did I make from the money I spent on ad budget?”.
A percentage from 0 – 100%. A user eithers engages with your website during a session, or they don’t. It’s black and white, a yes or no.
If a user engages with your site, by clicking around, scrolling etc, that session is 100% engaged.
Conversely, if the users lands on your page then leaves again, the session was 0% engaged.
The Engagement Rate is your engaged sessions divided by your total sessions.
Why is this helpful? It gives you an indication of whether your site content is resonating with its audience. By looking at the Engagement Rate of different sources/mediums/channels, you can figure out if your messaging is wrong, either on your site, or on that channel.

You should have a good idea of what this is from setting up your conversion events earlier in this article.
If not, events are specific tracked actions which GA4 keeps tabs on. Things like page views, clicks, scrolling etc. Custom events can be created which track things you’re interested in, like form submissions and purchases.
Why is this helpful? You can mark custom events as conversions in GA4’s settings, and it will segregate that data out for you to help track attribution.
Self-explanatory, right? If you have purchases on your site, you can pass that payment data to GA and it will show you more data about the users/sessions responsible.
Why is this helpful? For the same reason tracking conversions is helpful. It allows you to track attribution of purchase, discover your most profitable channels, and calculate ROAS/ROI.
I’m a strong believer that metrics should serve a tangible purpose for a business.
You may have heard the term “vanity metrics” before. It essentially covers metrics which sound great on paper, but actually serve no real purpose.

Vanity metrics are employed for one of two reasons:
I’ll help you to avoid #1.
It’s your choice if you want to be person #2, but know in the back of your head that I don’t respect you 🧐.
BRASS TAX TIME: You’re employed because somebody wants you to make them money. Either the owner of your business, or your client.
As such, the only metrics that actually matter are…wait…there’s only one. Revenue.
All other marketing metrics serve one of the following purposes:
Every metric has its place, but you should employ them in the correct way.
Here are some examples to help you internalise this:
Where possible, always bring your reporting back around to real, tangible business goals.
If users can purchase online, make revenue your headline metric.
If users fill out a lead form, make conversions your headline metric (at that point, the revenue is a problem for the sales team, as long as you’re providing qualified leads).
If you’re also the sales team, get a raise, you’re doing two jobs in one.
The point is, nobody in your business outside of marketing gives a damn how many users the website has had. Revenue and conversions actually interest people.
Keep it real.

Ok, so how do you actually interpret the data and avoid reporting on vanity metrics?
Here are some common scenarios you might come up against:
Side note: You’re likely to see lower engagement on blog posts, as people tend to come in, read them, then leave satisfied. All the more reason to put links to your other pages within your blog copy and a nice juicy CTA at the end 😉.
Alright, that’s enough Analytics for now. If you’ve made it this far, you should now have an idea of:

You’re officially one step closer to being a “woah” marketer. Nice going. 👍
If you’ve found this helpful, why not get more like it and subscribe to my Clarity newsletter? It won’t all be super long stuff like this, but I promise anything I send out is actionable, relatable, and full of gifs. If you hate gifs, you’re on the wrong website 🤷
Founder of Latent Clarity and author of the Clarity newsletter.
I help new and solo marketers be the best they can with practical, actionable, (and sometimes funny) advice.